Using Excel addins (third party, on Windows)
Many third-party libraries are only delivered as Excel add-ins. While using Excel is exactly the opposite of what we advocate, sometimes you may have no choice, for example if you have to use 3rd party Excel add-ins.
The simplest way to add such libraries to our framework Python’s Application.Run.
The only problem with this approach is that it is not fully automated. An open Excel session with the addin loaded is required when running Python scripts containing Application.Run.
Excel add-in
Implement the functions we defined in Using Python and C++ libraries, in an Excel add-in.
Function mySquare(a As Double) As Double
mySquare = a * a
End Function

Function myCube(a As Double) As Double
myCube = a * a * a
End Function
Save the add-in as “addinTest.xlam”.
Run the Excel add-in
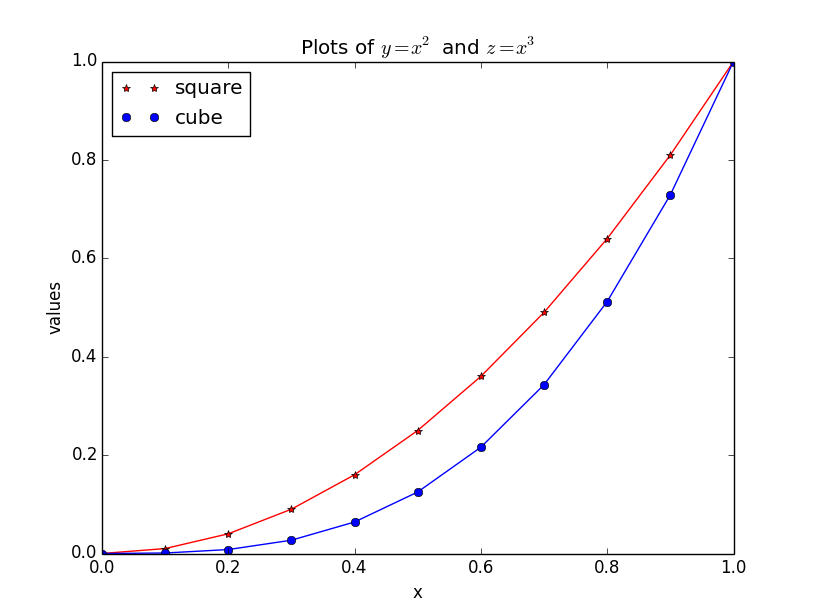
Click on the file “addinTest.xlam” you just saved. Then paste the code below in an interactive Python session. This will produce the plot below.
import win32com.client
xl = win32com.client.Dispatch("Excel.Application")
from matplotlib import pyplot as plt
N = 10
x = [i/N for i in range(0,N+1)]
y = [xl.Application.Run('mySquare', t) for t in x]
z = [xl.Application.Run('myCube', t) for t in x]
plt.plot(x, y, 'r')
plt.plot(x, y, '*r', label='square')
plt.plot(x, z, 'b')
plt.plot(x, z, 'ob', label='cube')
plt.xlabel('x')
plt.ylabel('values')
plt.title('Plots of $y = x^2$ and $z = x^3$')
plt.legend(loc='upper left')